This was the technical condition of the markets three years ago as unbeknownst to everyone Covid was about to demolish 1/3 of the S&P's market value in 22 short days.

We were short for much of that decline. Here are some of our trades, real time, real money:
Blue Line Trading Premium Service Trades: Mar-Apr-May 2020

Residual Legal Training: Past Performance is no guarantee of future results.
Fast forward to mid-February 2023 and compare the S&P now to what it looked like three years ago:
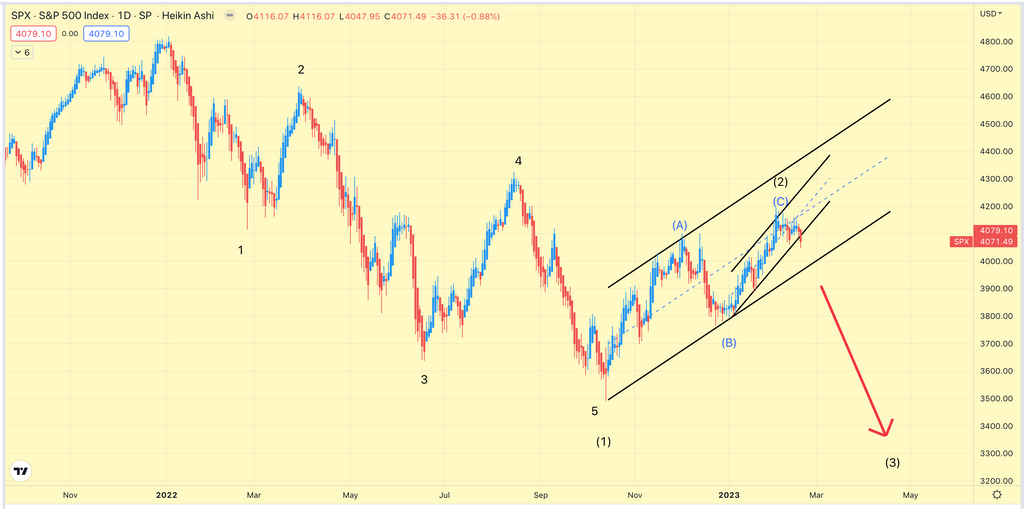
We haven't loaded up on puts yet because the key levels that trigger our trades have not (for the most part) been violated. It's not enough to simply trace out a tradable pattern, there must be some price momentum in the direction of the expected new trend for our bells and whistles to go off. That's what triggers the kinds of trades shown on the above table from three years ago. It keeps us from positioning too early, if at all. When the key levels are hit and whether intraday or on a closing basis, the trades go out and that is when capital is put into play.
So what else are we looking at these days?
TSLA

I have a lot to say about TSLA, but reserve most of it to the Blue Line subscription services, or at least tell them first. Note one entry on the 2020 Trades Table above, the second trade on the list, dated March 25, 2020. The trade went off the board at options expiration, Jun 19, 2020. Coming out of the dust of the Covid Crash lows, we doubled our money on TSLA shares, but did much, much better with TSLA Jun 19th 2020 calls, up over 800%. I've included on the chart TSLA prices at some longer term monthly option expirations that did not make the above trade table date cut-off, i.e. food for thought...see video below:
TSLA Buy Signals (Oct 24, 2020)
 Mar 25, 2020 Buy Signal with Longer-Term Option Expirations